Value of biologicals, biostimulants and soil/fertilizer nutrient enhancement products
Value of biologicals, biostimulants and soil/fertilizer nutrient enhancement products
At present, the upcoming crop production season looks to be difficult, financially. The intent of this article is to bring producers up to date about what we know about the “other stuff” – purchased inputs other than seed, pesticides, lime and fertilizers. In this category we include microbials; biostimulants and soil nutrient availability enhancers; and fertilizer additives intended to increase/extend fertilizer nitrogen (N) and phosphorus (P) availability. We’ve done research for wheat, soybean and corn, so that is how this article is organized.
Wheat – The Kentucky Small Grain Growers commissioned a study that was especially focused on seed treatments but also included evaluation of some foliar materials and fertilizer additives (Table 1). With Bill Bruening’s help, the work was done at Princeton on a Crider silt loam.
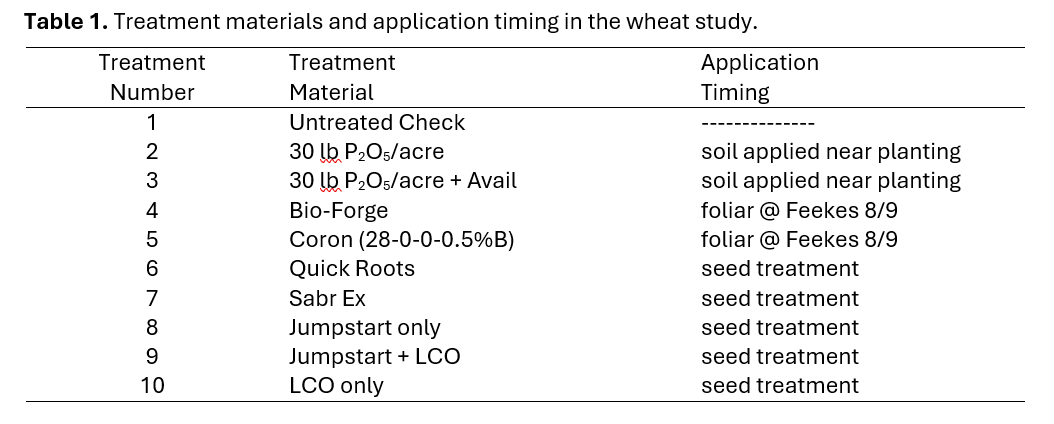
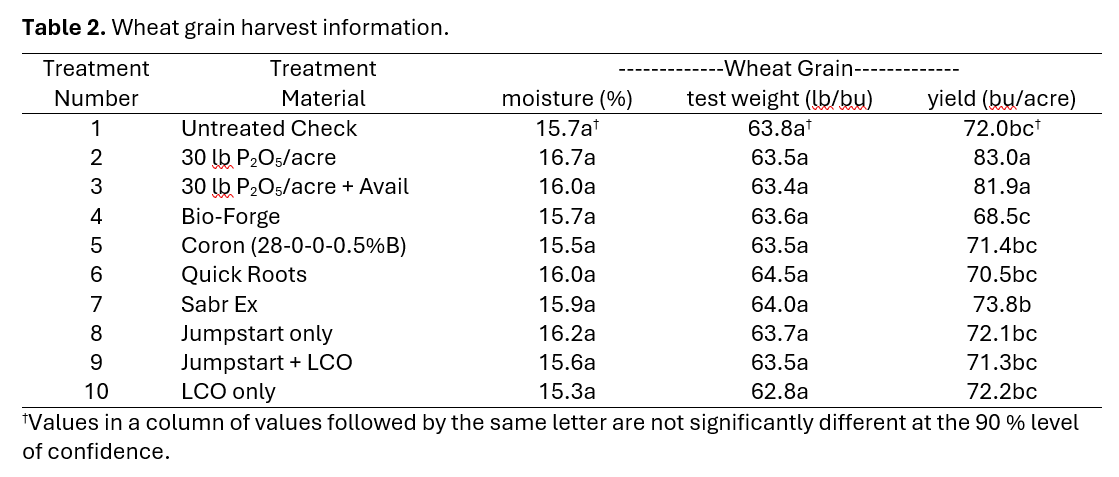
The phosphate application rate was determined from soil test results for the field area. Avail is a phosphate fertilizer additive; Coron is a foliar nutrient source; Quick Roots, Sabr Ex and Jumpstart are microbials; and Bio-Forge (N,N’-diformyl urea) and LCO (Lipo-chitooligosaccharide) are chemical biostimulants. There were 6 replications of each treatment to increase our ability to find statistically significant differences. We evaluated stand establishment (due to the seed treatments), flag leaf tissue nutrient composition at heading, and grain yield. Yield and quality will be our focus (Table 2). That said, the seed treatments had no effect on plant stands, which averaged 23.8 plants/ft2. Impacts on flag leaf nutrient concentrations were also minimal. Leaf N and P were increased by phosphate fertilizer application, but Avail made no difference. Leaf boron (B) was raised by Coron use.
None of the additives made any difference in wheat grain quality or yield (Table 2). Harvest grain moisture was unaffected by any treatment. Grain test weights were high and unaffected by any treatment. There was a large and statistically significant yield increase, 10 bu/acre, to phosphate fertilizer application, but Avail did not further increase yield.
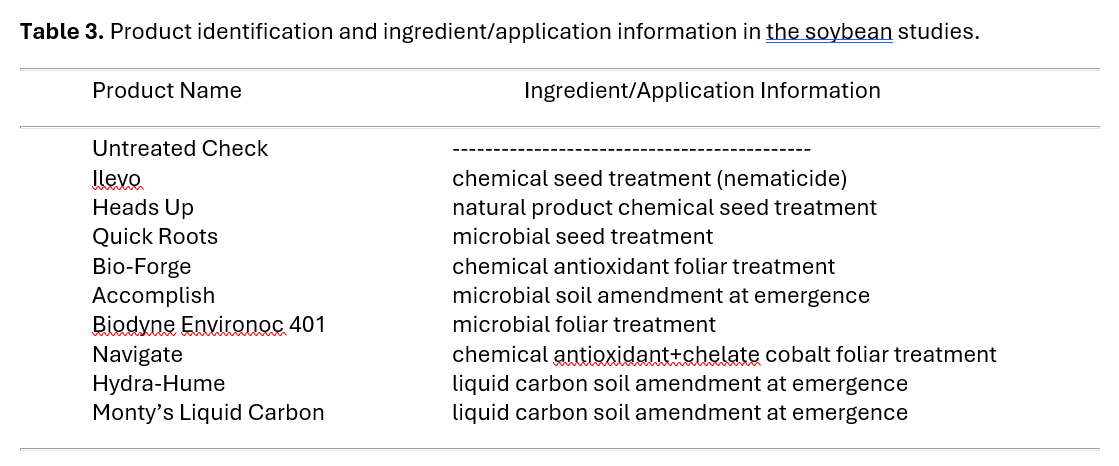
Soybean – The Kentucky Soybean Promotion Board supported a similar study of different products, focusing more on soil and foliar-applied materials (Table 3). The work was done with full-season soybean at 8 variety trial locations across Kentucky with the assistance of Claire Venard.
We evaluated stand establishment (due to the seed treatments), top trifoliate leaf tissue nutrient composition at early flowering (R1-R2), and grain quality and yield. There were 6 replications of each treatment at each location. Yield will be our focus (Tables 4 and 5). Plant establishment varied with location, above 140,000 plants/acre at the top two locations in Clinton and Pulaski counties and below 124,000 plants/acre at the bottom two locations in Calloway and Fayette counties. At any one location, or across all locations, there was no effect of any seed treatment on plant establishment, which averaged 131,400 plants/acre across all sites. The same was true for R1 leaf tissue nutrient composition – despite considerable variation due to location, there was no impact of any treatment on leaf N, P, potassium (K), calcium (Ca), magnesium (Mg) or sulfur (S) at any location or across all locations. The same was true for leaf B, iron (Fe), manganese (Mn) and zinc (Zn).
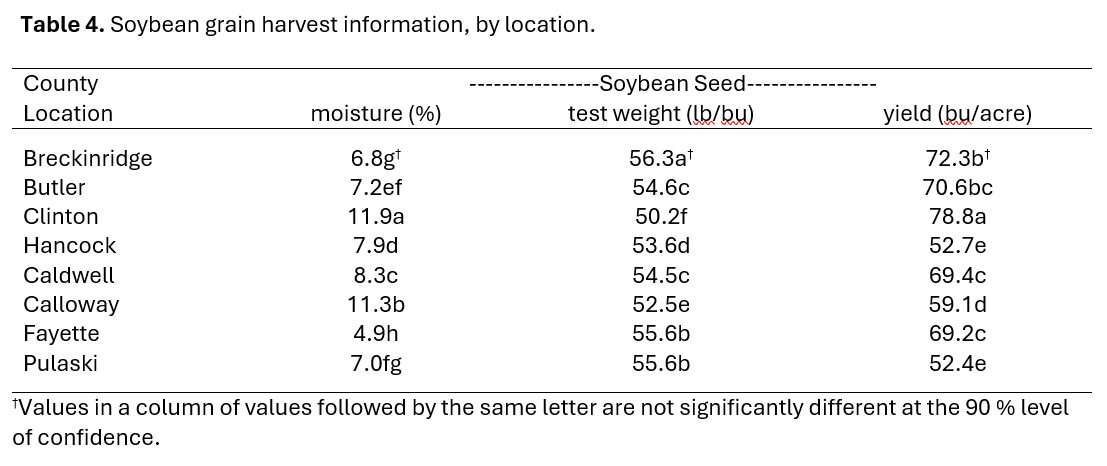
Due to site/location, there was significant variation in harvest grain quality (moisture and test weight) and yield (Table 4). Harvest grain moisture was generally low, as was test weight for the Pioneer 45T11R cultivar that was grown at all locations. Grain yield was significantly different among locations. Yields ranged from 79 bu/acre in Clinton County to 52-53 bu/acre in Pulaski and Hancock counties (Table 4).
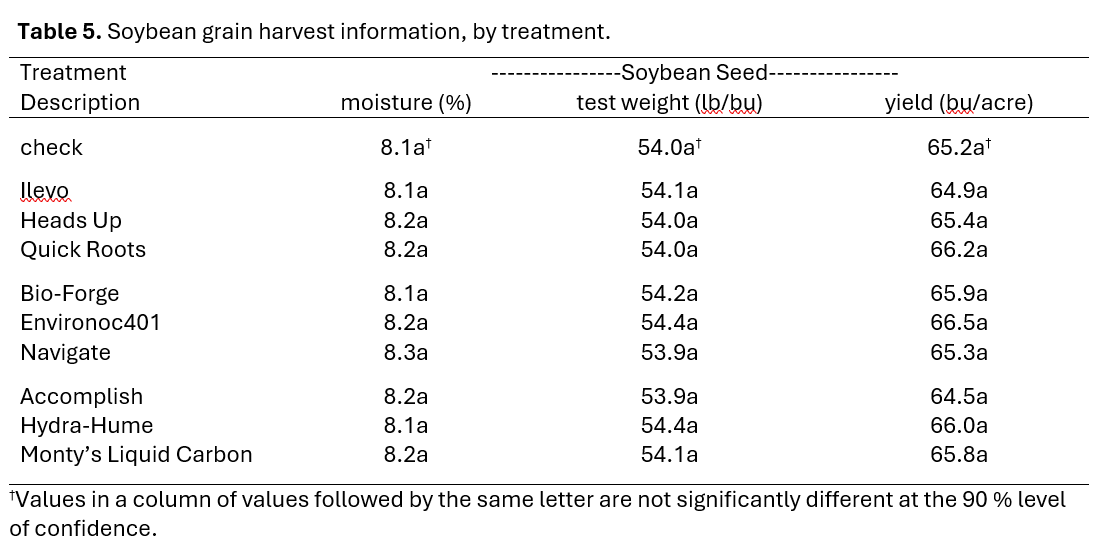
Despite the site-to-site variation, there was no influence of any of the seed treatments, foliar materials or soil amendments on soybean harvest grain quality or yield within any location. Further, no effect of these treatments was observed on across-location yield quality or yield (Table 5). Grain moisture averaged 8.2 %; test weight averaged 54 lb/bu; and average grain yield was nearly 66 bu/acre (Table 5).
Corn – The Kentucky Corn Growers Association also supported a study of these products, the balance favoring seed treatments and foliar-applied materials over soil amendments (Table 6). The work was done at 5 variety trial locations with the assistance of Cam Kenimer. Two locations were irrigated and seeded at 36,000/acre. The other three sites were dryland and planted at 32,000 seed/acre. Again, there were 6 replications of each treatment at each location.
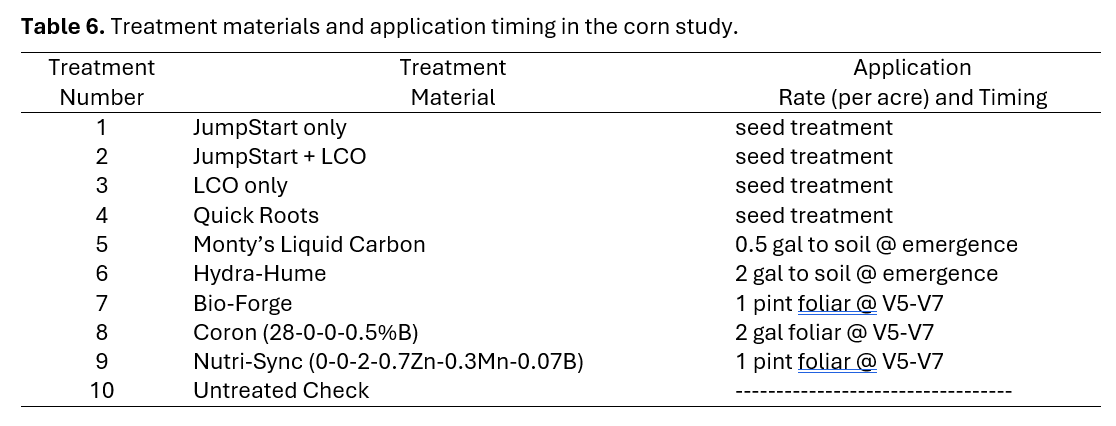
We evaluated stand establishment (due to the seed treatments), ear leaf tissue nutrient composition at early-mid silking (R1-R2), and grain quality and yield. There were 6 replications of each treatment at each location. Yield will be our focus (Tables 7 and 8). Initial plant stands reflected the fact that the Christian and Fulton locations were seeded with 4,000 more seed/acre, and that we exceeded our target seeding rates (32,000 and 36,000 seed/acre) by 4,000 seed per acre. Stands were not affected by treatments; treatment averages ranged from about 37,000 to about 38,000 plants/acre. No seed treatment resulted in stands different from those found in the check. Despite considerable differences due to location, there was little influence of any of the ten treatments, across locations, on corn nutrition as indicated by the ear leaf nutrient element concentrations. There was a small negative effect of Jumpstart (only) and Hydra-Hume on leaf N relative to the check. There was a small positive effect of the LCO (only) on leaf S relative to the check. Leaf B was raised by Coron application. There was no location by treatment interaction. When evaluated at each location, no treatment influenced a leaf nutrient concentration in a manner different from that observed when all locations were averaged together.
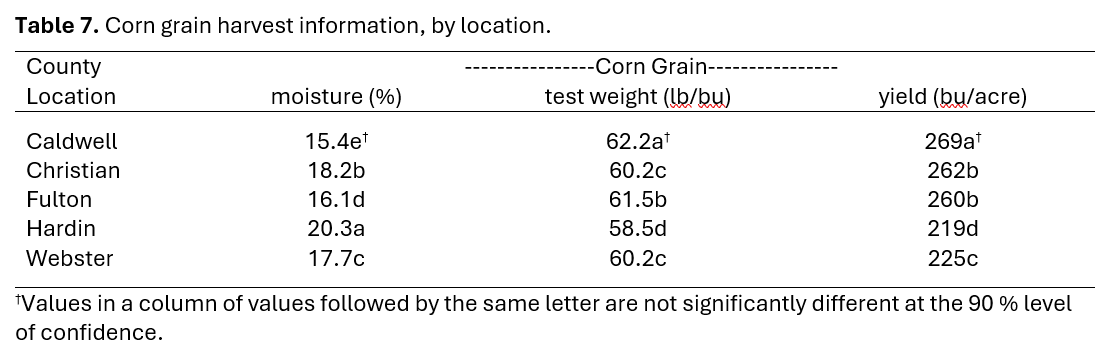
The grain harvest parameters were all significantly different according to trial location (Table 7). Grain moisture was significantly different by location, ranging from just over 15% in Caldwell County to just over 20% in Hardin County (Table 7). Grain test weight was similarly individual, with the highest (62.2 lb/bu) average value in Caldwell County and the lowest (58.5 lb/bu) average value in Hardin County (Table 7). Grain yield was significantly different among locations (Table 7), with the highest average yield (269 bu/acre) in Caldwell County (unirrigated) and the lowest average yield (219 bu/acre) in Hardin County (also unirrigated). The two irrigated corn trials, in Christian and Fulton counties, averaged about 260 bu/acre (Table 7).
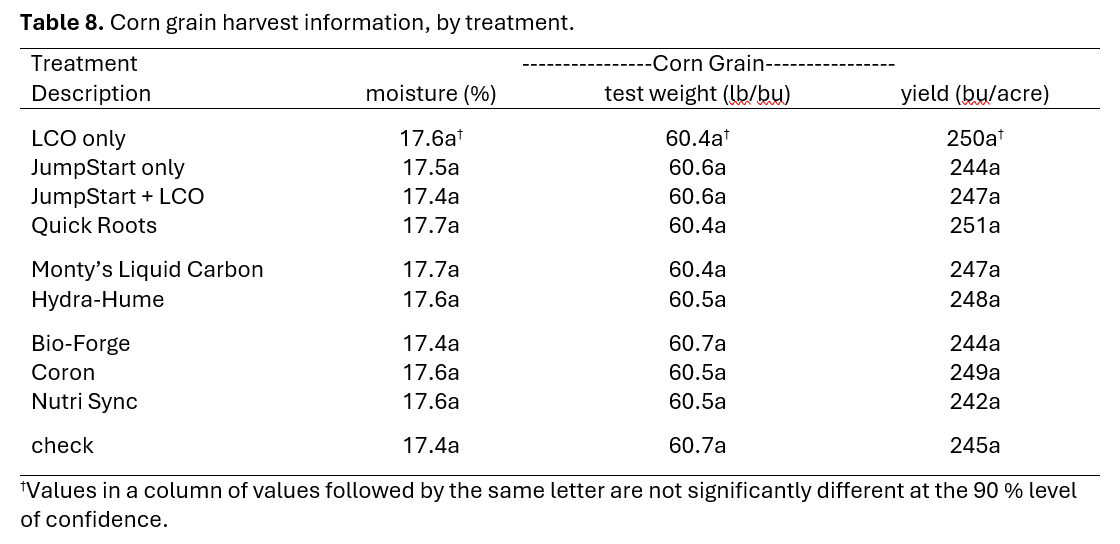
There was no influence of any of the ten treatments on corn yield parameters (Table 8). Grain moisture averaged around 17.6 %; test weight averaged about 60.6 lb/bu; and average grain yield was about 245 bu/acre (Table 8). There was no location by treatment interaction. When evaluated at each of the five locations, none of the treatments significantly influenced grain moisture, test weight or yield at any one location in a manner different from that observed when all locations were averaged together, e.g. no treatment differences at any one location. The large impact of location on grain yield parameters (Table 7) contrasts greatly with the non-existent effect of treatments on those same yield parameters (Table 8).
The data taken in this series of field trials is entirely consistent. There was no impact of the treatments, positive or negative, on wheat, soybean and corn establishment or yield. There were minimal treatment impacts on plant nutrition. This lack of effect was consistent over a range in location-average yields, across three grain crop species, over many production environments (including both irrigated and unirrigated corn), and over many different soils. The general lack of yield benefit to use of these microbials, biostimulants, soil carbon and fertilizer enhancement products translates into significant negative economic impact to producers who use them. Though some might be purchased at a relatively low price, a negative return on investment (ROI) is likely even for those.
| Citation: Grove, J., Ritchey, E., 2025. Value of Biologicals, Biostimulants and Soil/Fertilizer Nutrient Enhancement Products.Kentucky Field Crops News, Vol 1, Issue 10. University of Kentucky, October 10, 2025. |

|

|
Related Information